Home
Varsity Baseball, Data Science Class Team Up
At St. Albans, the teacher-coach education model is central to our identity as a school. Dozens of faculty members shed their coats and ties for whistles and athletic clothes when classes end, flocking to gyms and fields to guide their students in competition.
It is less common, though, to find athletics anchoring a unit lesson in the classroom. Flipping the traditional teacher-coach model on its head, Mr. Bowman Dickson is using St. Albans athletics to drive the most recent unit in his course, Data Science with R.
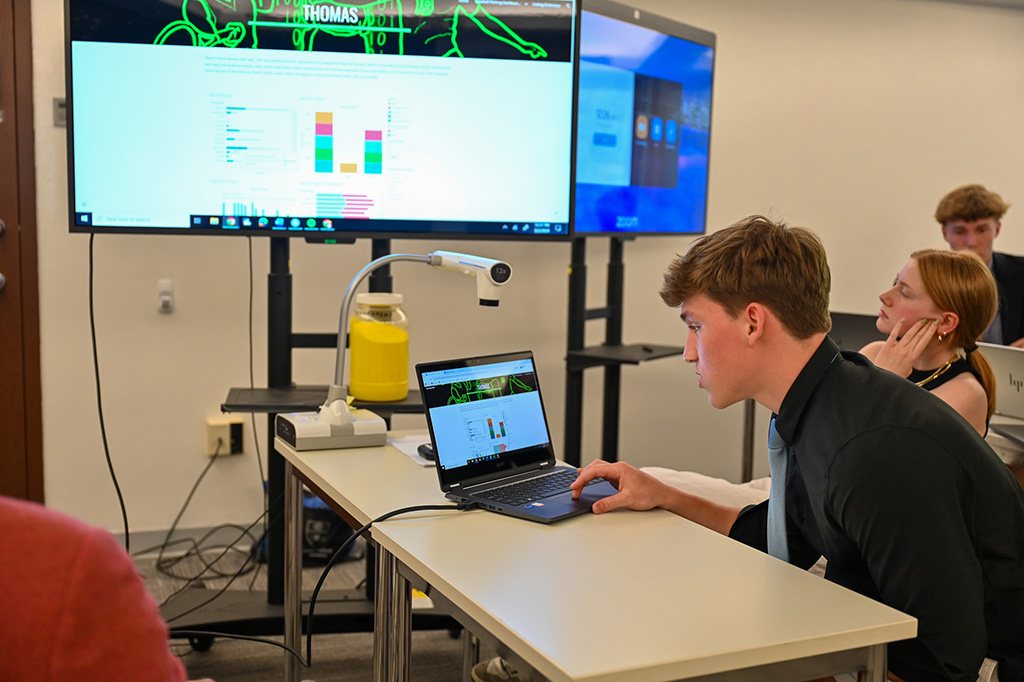
The class, which has focused on sports analytics all semester, utilizes the coding software R to run statistical analyses on a variety of sports-related datasets. Students use the program to create dashboards that provide easy-to-understand visualizations of complicated data.
It’s no secret that baseball has been leading the way in the recent revolution in data analytics in professional sports. With front offices relying on large teams of analysts and programmers to create game strategies, teams are now investing millions of dollars in sports analytics. Mr. Dickson’s class paid a visit to the Nationals front office for a field trip, where they learned about how the team approaches analytics in their organization.
Enter the St. Albans baseball team.
Beginning in 2023, the team began using spreadsheets to track and measure pitcher performance. Managers and reserve players sat in the bleachers behind home plate with a radar gun and a Google Form. After each pitch, they recorded the velocity, the type of pitch, and the outcome: ball, called strike, swinging strike, foul ball, or in play, among other data points.
That data then synchronizes in a spreadsheet, where the data is put through various formulas to provide helpful information to evaluate performance and identify room for improvement. Coaches can then build practice plans and develop game strategies based on these indicators.The only problem: The data can be hard to understand.
This created a perfect opportunity for Mr. Dickson’s class to come to the rescue. Following spring break, the class synthesized more than 4,000 lines of code into easy-to-read dashboards to model the performance of their peers on the baseball field.
As students learned how to use data visualization software effectively, coaches deepened their understanding of how players were performing and needed to improve.
“The dashboards immediately became a valuable tool for our pitching staff,” said Pitching Coach Jack Besser. “Now, we can easily compare player performances, including how well players perform at different points of the game, what pitch is most effective at certain moments, and where players need to improve.”
Mr. Dickson describes this type of translation from raw data to actionable insight as the center goal of his Data Science class. “It would have been easy to just make a bunch of random graphs with the data,” Dickson said, “but the goal for my students in this project was to create something that provided new information for the baseball team but also communicated it in a way that non-data people could understand.”
As the baseball team heads into the DCSAA state tournament and beyond, these dashboards will play a huge role in their preparation. As for the students in Mr. Dickson’s class, perhaps a future in a professional sports team’s front office awaits.
St. Albans School
Phone: 202-537-6435


Located in Washington D.C., St. Albans School is a private, all boys day and boarding school. For more than a century, St. Albans has offered a distinctive educational experience for young men in grades 4 through 12. While our students reach exceptional academic goals and exhibit first-rate athletic and artistic achievements, as an Episcopal school we place equal emphasis upon moral and spiritual education.